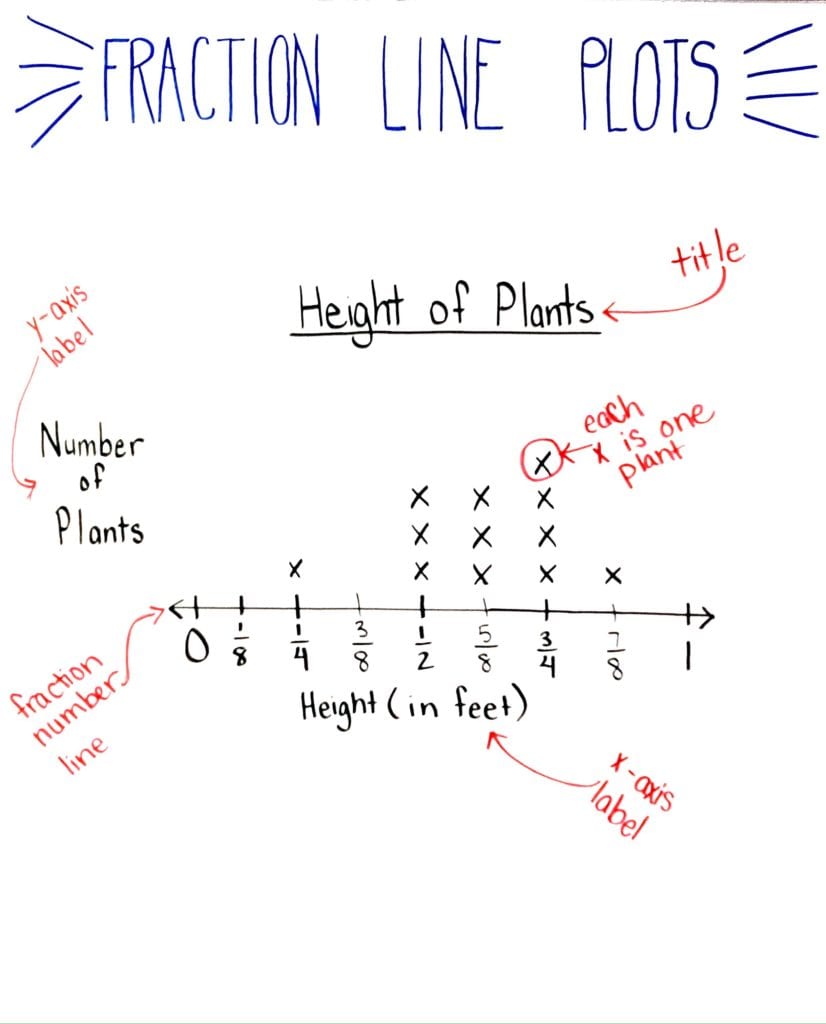
Fraction line plots may seem daunting, but teaching them gets a lot easier with these five tips!
When I started teaching the Common Core State Standards and came to the standard about Making and Interpreting Fraction Line Plots, frankly, I was at a total loss. Wait, what’s a line plot again? They have fractions now? And not only that, but my students need to interpret line plots with fraction addition and subtraction?
I have learned a LOT about how to make this standard attainable for students, and here are some tips I learned along the way.
Are you looking for more ideas to mix up your math lessons and engage your students? Check out my FREE Guide to an Engaging Math Lesson! It has tons of ideas for creating variety in your math lessons while keeping your students engaged and learning!
Fraction Line Plots Tips
Teach the Math Vocabulary
This standard is a part of the Data Analysis Domain, and students may not know (or remember) what mean, median, mode, and range are. Be sure to explicitly teach this vocabulary. Getting students to remember their math vocabulary terms can be tricky. I’ve written a blog post all about this to help you HERE.
Teach Fraction Operations FIRST
Students need a foundation in fraction operations skills before tackling this topic. Make sure your students can:
- Add and subtract\ fractions with unlike denominators.
- Change improper fractions into mixed numbers.
- Simplify fractions.
- Some understanding of multiplying and dividing fractions will come in handy too
Ease Into Line Plots
I learned this one the hard way. The first time I taught fraction line plots, I jumped right in. Just like jumping into a freezing swimming pool, I jumped out and reconsidered almost immediately. Students SHOULD HAVE learned the basics of a line plot in fourth grade, but often, they need a refresher about how line plots work.
I always start with making sure they remember how line plots function as well as how to answer some of the question types while using whole numbers. Next, I make sure to ease into the difficulty of fractions in the plot. At first, it seems like, my kids can TOTALLY add fractions up to eighths, no problem! But, when you toss the added difficulty of dealing with a line plot into the mix, it can be much trickier for them than you may have expected. After the whole numbers, I stick to fourths and halves for a few graphs before working into the eighths.
Take Your Time
I usually spend at least a week on this topic. It can take the students some time to really get a handle on how to interpret the questions. There are several TYPES of questions in these line plots. Students need time to process one type of question to the next. It also takes students some time to build strategies for solving the various question types more efficiently.
Have the Students Create their own Fraction Line Plots
At the end of the unit, I have my students create their own graphs. This can be about a set of data I have given them. Or, to take it to another level of Bloom’s Taxonomy, students can gather their own data about a topic that interests them (fraction data, of course).
After gathering data, students create a line plot to show the information. Next, they create a set of questions they would ask about the graph if they were the teacher. We then spend a day where students get to partner up and answer each other’s fraction line plot questions. This makes an AWESOME culminating activity for the test, or project to grade as an alternate assessment!

Next Steps for Fraction Line Plots in the Classroom
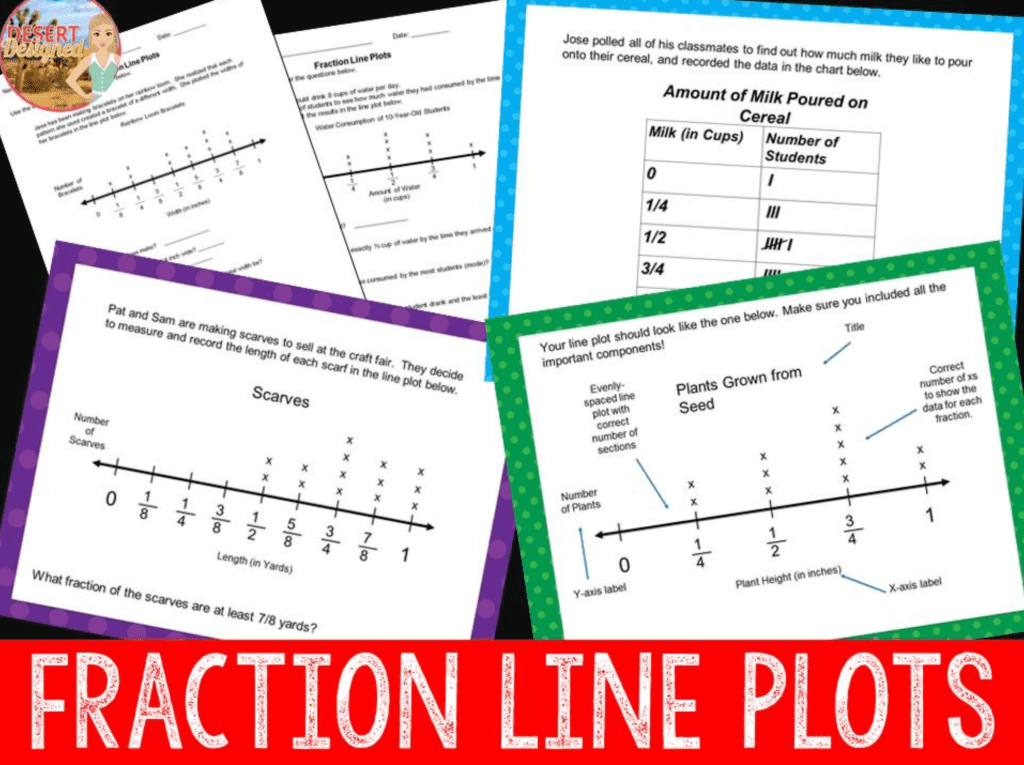
Several resources that will help you to teach fraction line plots to your students are my Fraction Line Plots Boom Cards and Fraction Line Plots Unit.


In this unit, you will find:
- A data analysis vocabulary slide
- Introduction to (or review of) line plots lesson using whole numbers
- Slides with accompanying student worksheets for 7 different line plot graphs with questions to help the teacher guide the students through the lesson
- Lessons to help students create their own fraction line plots and Fraction Line Plot interpretation questions.
- A post-test
- Answer Key
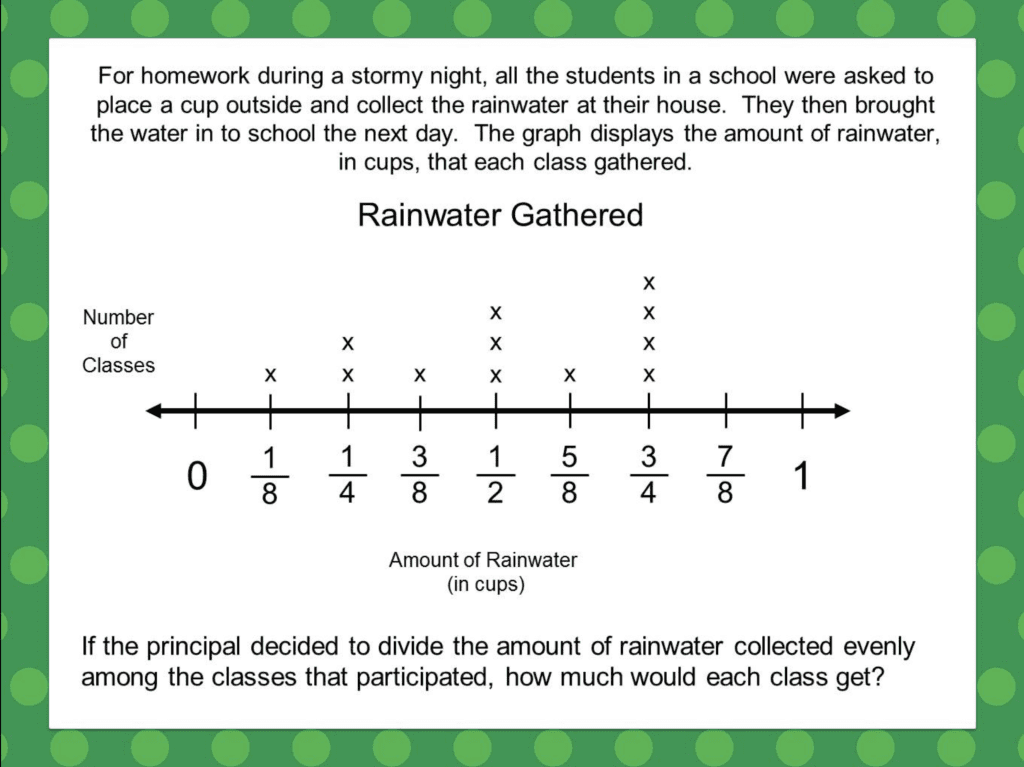
Here is an example of one graph slide (notice the single question at the bottom) and student page from the unit:

I think you will find that these products really make teaching your students to make and interpret their own fraction line plots a breeze! Comment below on any suggestions you have, or more tips you may have for teaching this to your students!
AND! Don’t forget to download your FREE Guide to an Engaging Math Lesson today!
Happy teaching!


